About the morphology of colonies

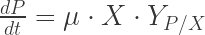
Eureka, today’s post covers some general information about the morphology of bacteria, yeasts and other microorganism on agar plates and why it is important to know at least a bit about it to get the most information out of your agar platings.

Q: What do you mean by morphology of colonies?

The morphology of a colony describes how microorganisms appear on agar media such as Sabouraud, malt agar etc. Morphology just describes the colonies. If you streak some microorganisms on agar plates, they grown (if the media is appropriate for this particular organism) and form visible colonies. The colonies appear as spots like shown in Fig 1. It is important to remember that a colony are thousands to millions of microorganisms together, not a single microorganism cell. Ideally all the cells within a colony originated from one single cell at the beginning (clonal expansion). If single cells are closer together on the agar, the individual colonies overlap and no single colonies are visible (left-upper part in Fig 1). In this case, the concentration of the yeasts is just too high to observe individual colonies.

Fig 1: Brettanomyces bruxellensis on Sabouraud agar plate after 11 days

Fig 1 shows what you get if you streak some Brettanomyces yeast on Sabouraud agar. The roundish spots are the colonies (as you can see on the right side in Fig 1).

Q: How do you get single colonies?

To get an accurate description of a colony, single colonies are necessary. But how do you get single colonies in the first place? As mentioned above, if the individual cells after streaking are to close to each other, the colonies might overlap. To get single colonies one simply has to ensure a low concentration to prevent such colony-overlays. One example to do so is to dilute the cells directly on the plate itself by using a special streak technique called dilution streak or Z-streak (Fig 2). How this is done is shown in a video (YouTube) as well.

streak_2

Fig 2: Dilution streak done with three streaks

Begin with a cell suspension. You might even use a yeast slurry in the first place. A first streak is done to get some cells on the plate (Fig 2, streak 1). One expects a lot of cells visible on the trajectory of the first streak and the individual colonies overlay each others. After the first streak, you sterilize your inoculation loop, let it cool down and collect some cells by passing the inoculation loop through the first streak for a second one. This time the concentration of cells is already lower because you only pick a subset of yeast cells. This process can be done for a second time to get three streaks in the end (Fig 2). The plate after a dilution streak might look like shown in Fig 1. Unfortunately, there are no colonies visible in the third streak anymore. Anyway, I hope you get the idea.

Single colonies are not only useful to describe their morphology but also to differentiate between different microorganisms. For instance, if you are interested in separating the Saccharomyces yeasts (brewer’s yeast) from Brettanomyces yeasts you can use the dilution streak and hopefully some colonies arise from single Saccharomyces colonies and others from Brettanomyces cells.

Q: Why is the morphology important?

Lets assume the morphology of a colony, representing one kind of microorganism (remember the concept of the single cell at the beginning), is unique for every microorganism there exists. The morphological description could therefore be used to identify the kind of microorganism on your agar plate. This is just an assumption because there are a lot of microorganisms which have similar morphologies. To summarize, the morphology of the colonies can be useful to identify the kind of microorganism you have on your plate. Lets go through some examples. Have a look at Fig 3.

Fig 3: Girardin bugs on Sabouraud agar plate

I assume it is obvious that there are different kinds of colonies and hence morphologies. There are differences in shapes, size and colors. To conclude, different morphologies originate from different microorganisms. I can give you even further information here. The white colonies (big ones and wavy) are yeast cells, the flat beige ones bacteria. The very small white colonies are another kind of bacteria. You see, the morphology can even be used to differ between yeasts and bacteria. That’s why agar media are very common in microbiology labs to identify different kinds of yeast/bacteria. One application here could be to test a beer for spoilage organisms such as Lactobacillus (beer turned sour). Plate some of the sour beer on a plate where Lactobacillus can grow and if colonies arise with a typical Lactobacillus morphology, you can be certain to have a Lactobacillus contamination in your beer. I will not get into further detail about the different media and strategies used to do these tricks. Just to give you an idea what the whole agar media method is capable of.

Fig 4: Water kefir on Sabouraud agar plate

Maybe an example to show that the colonies are not always circular. Some microorganisms tend to form large flat colonies as it can be seen in Fig 4. In this case, I plated some of my kefir culture on a Sabouraud agar plate. You can even observe some yellowish colonies. Colonies are not always white or beige either. Not only can you choose different kind of agar media but also add some dyes for further characterization. One such example is shown in Fig 5. In this case bromocresol green is added to differentiate between microorganisms that can grow as white colonies and such as green ones. The color differences suggest that there are at least two different kinds of microorganisms on the plate shown in Fig 5.

IMAG1943

Fig 5: Jolly Pumpkin’s Madrugada Obscura dregs on bromocresol green Sabouraud agar

Q: How do you determine the morphology of a colony?

First you need a pure culture of the microorganism. This is important because the morphology can differ if other microorganisms are in the same colony. The morphology can even be different on other agar media. Lets assume you want to describe the morphology of a pure brewers yeast (Saccharomyces cerevisiae). The first thing to do is streaking the yeast on a suitable agar media with a dilution streak and incubate the plate until colonies arise like shown in Fig 6. Sabouraud is a typical agar media for Saccharomyces and other yeasts. Malt agar media works as well.

Fig 6: Wyeast’s 2112 California Lager on Sabouraud Agar plate

In case of Fig 6, I streaked some of Wyeast’s 2112 California Lager yeast on a plate to check the purity. Now what about the morphology? Lets take a single colony and describe the following characteristics: form, margin, elevation (shape of the colony from the side), size, texture, appearance, pigmentation, opacity. The following descriptions are just an example.

Fig 7: from: http://commons.wikimedia.org/wiki/File:Bacterial_colony_morphology.png#filelinks; (Adapted and redrawn from Seeley, HW & Vandemark, PJ (1962) Microbes In Action: A laboratory manual of microbiology. WH Freeman (San Francisco, London) by user Ewen)

One might describe the colonies shown in Fig 6 as following:

Margins: Entire
Form: Circular
Elevation: Convex
Surface: Smooth
Opacity: Not transparent, shiny
Color: Off-white

That is what you can expect when you streak a yeast colony on a Sabouraud plate. The morphology of Saccharomyces is very similar on malt agar. Maybe some of you observed that there are yet some other different colonies on the plate in Fig 6. There were some impurities in this yeast sample as expected in the first place.

Q: Is the morphology of a given microorganism always the same?

Unfortunately not. The morphology of colonies can depend on the type of agar media used, if oxygen is present, nutrients, vitality, pH-levels, incubation time, other microorganisms present… Just keep in mind that a morphology description is not universal. If you encounter a morphology description of a specific microorganism, always check the type of agar media used and the conditions how the plates were incubated.

Q: Is it possible to differentiate between Saccharomyces and Brettanomyces based on morphology?

One of the most simple tricks to differentiate between the two yeasts is the incubation time. Saccharomyces colonies arise relatively quickly (within few days). Brettanomyces grow much slower (days to weeks). The second trick is to use a microscope and have a look at the different colonies. A third one might be (haven’t tried that one yet) to inhibit the growth of Saccharomyces by adding some growth inhibiting substances. Differentiating those two yeasts based on morphology is not that easy in my opinion.

Q: Is it possible to differentiate between top and bottom fermenting yeasts or even yeast strains based on colony morphologies?

As far as I know and from my experiences, differentiating between bottom and top fermenting yeasts base on colony morphologies is not possible. And it is not possible as well to differentiate between different yeast strains as well. Although I encountered some different morphologies for wheat strains at one point. However, I would not do any strain differentiation based on morphologies.

I hope there were some useful information in this post to give you a better understanding of agar media cultivation. Agar media are a very powerful tool in microbiology and is also widely used in breweries to check for impurities in beer or water. Understanding the concept of colony morphologies is therefore very important to get the most information out of agar media cultivation. And know about some limitations of the method as well.

A glimpse into Brettanomyces growth kinetics

Eureka, second yeast kinetic post. I further discuss Monod growth kinetic models with the inclusion of some inhibition parameters. I would advice you to first read the yeast kinetic introduction post if you haven’t done so already. One inhibition phenomena has been studied on Brettanomyces by looking at growth behaviour under aerobic and anaerobic conditions and the influence of initial acetic acid. All the values of the coefficients are taken from a publication written by Yahara et al (2007). The goal of this publication was to investigate the glucose utilization rate of Brettanomyces bruxellensis at different acetic acid levels under aerobic and anaerobic conditions. The authors first conducted experiments and then proposed an extended Monod model to simulate the growth kinetics under different conditions.

I would like to start by discussing the basic equations used for the extended Monod model used by Yahara et al (2007). The basic Monod equations have been discussed in my introductory post.

\mu = \mu_{max} \frac{S}{K_S + S + K_i^q \cdot S \cdot X^q}

\frac{dX}{dt} = \mu \cdot X

\frac{dS}{dt} = - \frac{\mu \cdot X}{Y_{X/S}}

\frac{dP}{dt} = \mu \cdot X \cdot Y_{P/X}

  • µ specific growth rate [h-1]
  • µmax maximum of the specific growth rate [h-1]
  • X is the biomass concentration [g L-1]
  • S is the substrate concentration [g L-1]
  • KS is the substrate saturation constant [g L-1]
  • Ki is the reciprocal of the inhibitor constant [L g-1]
  • q is the exponent for the inhibitor constant and biomass [ – ]
  • YX/S Biomass on substrate yield coefficient [gX gS-1]
  • YP/X Product on biomass yield coefficient [gP gX-1]
  • dX is the change of the biomass concentration [g L-1]
  • dS is the change of the substrate concentration [g L-1]
  • dP is the change of the product concentration [g L-1]
  • dt is the change of time when dX and dS happen [h]

The first differential equation for the specific growth rate µ is now slightly modified to include an inhibition factor Ki and an exponent q. The authors cultivated Brettanomyces bruxellensis under aerobic and anaerobic conditions with varying initial acetic acid concentrations (1, 2, 3 and 4 g L-1). The substrate (glucose) and inoculation rate were the same throughout the whole experiments. Two products were included into the model, ethanol (P1) and acetic acid (P2). The only difference in the Monod model here are two different yield factors (YP/X) and one equation for ethanol (dP1/dt) and one for acetic acid (dP2/dt). µmax was obtained the same way as I showed in the introduction post. All the remaining coefficients were obtained by iterative approaches.

I would like to show some of the growth curves published by Yahara et al (2007) which I obtained by using their coefficient values running the model using Berkeley Madonna.

Aerobic growth and acetic acid concentrations

Aerobic growth and different initial acetic acid concentrations. All the graphs show the substrate concentration (glucose) in red, the biomass concentration in black, the ethanol concentration in green and the acetic acid concentration in blue. In addition, I included the values of the coefficients in the individual graphs.

1a

Fig 1: Aerobic growth with initial 1 g L-1 acetic acid. Glucose (red) g L-1, yeast biomass (black) g L-1, ethanol (green) g L-1, acetic acid (blue) g L-1

The first graph shows the growth one can observe under aerobic conditions and an initial acetic concentration of roughly 1 g L-1 (Fig 1). The glucose is fully metabolized by the yeasts within 100 h of cultivation. It can also be observed that Brettanomyces produce ethanol and some acetic acid.

1d

Fig 2: Aerobic growth with initial 4 g L-1 acetic acid. Glucose (red) g L-1, yeast biomass (black) g L-1, ethanol (green) g L-1, acetic acid (blue) g L-1

The next graph shows the growth under aerobic conditions and an initial acetic concentration of roughly 4 g L-1 (Fig 2). In this case the glucose is not fully metabolized after 100 h as previously shown (Fig 1). The Brettanomyces still grow but at a slower rate. Still some ethanol is produced and a minor amount of acetic acid.

From these two graphs one can already conclude, that the amount of initial acetic acid in the media seems to significantly impair the growth of Brettanomyces. At higher acetic acid levels the Brettanomyces seem to grow substantially slower.

Anaerobic growth and acetic acid concentrations

The next graphs show the growth curves in absence of oxygen again with different initial amounts of acetic acid.

2a

Fig 3: Anaerobic growth with initial 1 g L-1 acetic acid. Glucose (red) g L-1, yeast biomass (black) g L-1, ethanol (green)

The graph shows the growth one can observe under anaerobic conditions and an initial acetic concentration of about 1 g L-1 (Fig 3). Yet again the glucose is fully metabolized within 140 h of cultivation as previously observed under aerobic conditions and low initial acetic acid concentration (Fig 1). Although the Brettanomyces under anaerobic conditions seem to metabolize glucose at a slower rate than under aerobic conditions. The Brettanomyces produce again ethanol. But no measurable amount of acetic acid. Under anaerobic conditions, Brettanomyces produces much more ethanol. In comparison to aerobic condition, the Brettanomyces grow faster in presence of oxygen.

2d

Fig 4: Anaerobic growth with initial 6 g L-1 acetic acid. Glucose (red) g L-1, yeast biomass (black) g L-1, ethanol (green) g L-1

At higher initial acetic acid concentrations and anaerobic conditions, Brettanomyces still grow but again at a slower rate (Fig 4). A lot of the glucose is not metabolized after 140 h of cultivation. The yeasts still produce some ethanol but the growth curve of the biomass stays roughly the same. Indicating a very slow growth rate.

Because the authors could not measure any acetic acid production under anaerobic conditions, one can conclude that the yeasts do not produce measurable amounts of acetic acid under anaerobic conditions. In addition, higher levels of acetic acid inhibit the growth of the yeasts.

Summary

Results published by Yahara et al (2007) showed:

  • B. bruxellensis grows faster in presence of oxygen
  • B. bruxellensis produces ethanol under aerobic and anaerobic conditions
  • More ethanol is formed under anaerobic conditions
  • In presence of oxygen and low amounts of initial acetic acid, B. bruxellensis can produce up to 4 g L-1 of acetic acid
  • Acetic acid can inhibit the growth of B. bruxellensis
  • No measurable amount of acetic acid is produced under anaerobic conditions
  • The proposed model based on a Monod model can describe the dynamic growth curves of B. bruxellensis

Uscanga et al (2003) already showed that B. bruxellensis grows faster in aerobic conditions, produces acetic acid in presence of oxygen, and higher initial amounts of acetic acid inhibits the growth of B. bruxellensis. In addition, Uscanga et al (2003) further showed that higher oxygen amounts lead to a decrease in glucose metabolization, the amount of ethanol produced decreases and the acetic acid level increases. This might be an indicator that high levels of oxygen inhibit the metabolism of B. bruxellensis as well like high initial acetic acid levels.

For the brewers: Brettanomyces slow grower under anaerobic conditions, form more ethanol but no acetic acid. Acetic acid is only produced if oxygen is present.

Quick word about models

One has to keep in mind that this model can’t describe everything. For example, if one runs the model using a high substrate concentration, the Brettanomyces will continue to grow even in presence of very high ethanol concentrations. In reality, Brettanomyces have an alcohol tolerance as well where they stop growing. However, this can easily be included in the model. This example was just to show that one has to be careful with models.

I hope this post was interesting to read and gave you an idea how models can be used to describe growth behaviours under inhibitory conditions.

The next post about yeast kinetic models will be concerning yeast calculators.

Bibliography

  • Kurtzman CP, Fell JW, Boekhout T (2011) The Yeasts, a Taxonomic Study. Volume 1. Fifth edition. Elsevier (Link to sciencedirect)
  • Uscanga MG, Délia ML, Strehaiano P (2003) Brettanomyces bruxellensis effect of oxygen on growth and acetic acid production. Appl Microbiol Biotechnol. 60: 157- 162; DOI: 10.1007/s00253-002-1197-z
  • Yahara GA, Javier MA, Tulio MJM , Javier GR, Guadalupe AUM (2007) Modeling of yeast Brettanomyces bruxellensis growth at different acetic acid concentrations under aerobic and anaerobic conditions. Bioprocess Biosyst Eng. 30: 389 – 395; DOI: 10.1007/s00449-007-0135-y

A glimpse into yeast growth kinetic models

Eureka, science post! Some math, model building and biology: I would like to start talking about yeast growth kinetic models today. In general, growth kinetics describes how different conditions (substrate, oxygen amount, metabolism products, inoculation rate, growth inhibitors etc) influence the growth of a microorganism in a time dependent manner. At the end one can construct mathematical models to describe the growth behaviour. In most cases one begins with experiments with fixed conditions and the growth of the organism is observed over time. A next experiment can be conducted with the change of one condition and the growth over time is observed once again. And so forth.

All these kinetic models can be very powerful tools. Not only can one improve for example the efficiency of yeast propagation but also investigate the effect of different parameters such as the inoculation rate of yeast, the substrate concentration, oxygen- or ethanol concentration on yeast growth. One application for growth kinetics could be to calculate yeast propagation like done in other yeast growth calculators for homebrewers. 

This post is a general introduction about yeast kinetics and I would like to show you how one can get from experimental data to a simple growth kinetic model. Future posts will go into more detail and I would like to give a general introduction first.

Exponential growth of microorganism

One of the most basic models in mathematical biology is the exponential growth equation for microorganisms. This equation can be used to calculate the amount of microorganisms or biomass (X) after a certain amount of time (t). Biomass can be the physical mass of the microorganisms, the cell concentration or any other measurement related to specify how many microorganisms there are (like optical density). I will stick to the physical mass of microorganisms as biomass in this post. In the exponential growth equation model no inhibition or substrate limitation is included. Substrate by the way is a term for any food source for the microorganisms such as glucose, maltose etc.

X_t = X_{t0} \cdot e^{\mu_{max} \cdot t - t_0}

  • Xt is the biomass concentration at the time point t [g L-1]
  • X0 is the biomass concentration at the time point zero [g L-1]
  • µmax is the maximum specific growth rate [h-1]
  • t Time [h]
  • t0 Time where the experiment begins. Normally zero [h]

Lets make an example. Lets say you have a 1 L yeast starter (with indefinite amount of substrate) and add 10 g of yeast (X0) at the beginning (t0). You might ask yourself how many yeast cells you have after waiting for 90 min. The only thing you might not know is the specific growth rate (µmax). These coefficients can be looked up and for yeast µmax is somewhere around 0.5 h-1. My solution for this question would be 21.2 g L-1. So roughly double the amount.

You can even calculate the doubling time (tD) after changing the previous equation (doubling time specifies the time needed to double the initial amount of microorganisms):

ln(\frac{X_t}{X_{t0}}) = \mu_{max} \cdot t

By the way, the equation above will be important later on to get µmax. Moving on, at the time of doubling (tD), Xt equals 2 times Xt0:

ln(\frac{2 X_{t0}}{X_{t0}}) = \mu_{max} \cdot t_D

ln(2) = \mu_{max} \cdot t_D

t_D = \frac{ln(2)}{\mu_{max}}

Common doubling times for Saccharomyces cerevisiae are around 90 min [1]. This gives you a µmax of roughly 0.5 h-1.

In the exponential growth equation model substrate limitations are not included and therefore makes it not that useful to fully describe the growth behaviour if you want to investigate the effect of the substrate concentration itself. Let go to the next model.

Monod equation for biomass

A very widely used model to describe the growth of microorganisms is the Monod model. The whole model is based on the Michaelis-Menten equation widely used in enzyme kinetics. I don’t want to go into further details here how one came up with these equations. In the end, the Monod model is again a simplified version of reality (like every model is). The first equation for the Monod model is:

\mu = \mu_{max} \frac{S}{K_S + S}

  • µ is known as the specific growth rate [h-1]
  • µmax is the maximum specific growth rate [h-1]
  • S is the substrate concentration [g L-1]
  • KS is the substrate saturation constant [g L-1]

We already know µmax, S is just the substrate concentration. For example the amount of dry malt extract you use for your yeast starter. Or glucose or whatever you are interested in. Just keep in mind that µmax depends on the used substrate. The definition of µ is:

\mu = \frac{dX}{dt} \cdot \frac{1}{X}

  • µ is known as the specific growth rate [h-1]
  • X is the biomass concentration [g L-1]
  • dX is the change of the biomass concentration [g L-1]
  • dt is the change of time when dX happens [h]

and depends on the change of biomass within an indefinite amount of time (dt). You could therefore write the Monod equation like:

\frac{dX}{dt}= \mu_{max} \frac{S}{K_S + S} \cdot X

and you already have your first differential equation for your model to describe the change of biomass in a time dependent manner.

This leaves KS. This is similar to the Michaelis constant Km in the Michaelis-Menten equation. In the case of the Michaelis-Menten equation, Km describes the substrate concentration at which the enzyme reaction is equal to half of the maximum speed. In the case of Monod, KS describes the substrate concentration (therefore S as index) where you have half of µmax. This is all so far for the first part of Monod.

Monod equation for substrate

In the previous section, I introduced the basic Monod equation which can be used to describe the change of biomass over time. Next we like to include the change of substrate. In case of yeast one might be interested to investigate the behaviour of dry malt extract. For that we have to introduce another coefficient:

Y_{X/S} = \frac{\frac{dX}{dt}} {\frac{dS}{dt}}

  • YX/S Biomass on substrate yield coefficient [gX gS-1]
  • dX is the change of the biomass concentration [g L-1]
  • dS is the change of the substrate concentration [g L-1]
  • dt is the change of time when dX and dS happen [h]

YX/S simply defines how much biomass you can get from substrate (thus the index X and S). For example how much biomass you get from one gram of substrate. Looking at the previous equations, you can already see how to get a differential equation for the substrate:

\frac{dS}{dt} = - \frac{\mu_{max} \frac{S}{K_S + S} \cdot X}{Y_{X/S}}

Per definition, the equation is multiplied by minus one because the slope of dS over dt is negative (substrate is metabolized and therefore only decreases).

This leaves us to look at product kinetics. In case of yeast, one might be interested to describe the production of ethanol as a product. This is very similar to the substrate shown above. In this case you need another yield factor:

Y_{P/X} = \frac{\frac{dP}{dt}}{\frac{dX}{dt}}

  • YP/X Product on biomass yield coefficient [gP gX-1]
  • dP is the change of the product concentration [g L-1]
  • dX is the change of the biomass concentration [g L-1]
  • dt is the change of time when dX and dP happen [h]

In this case the product depends on the biomass and not on the substrate. Once again one can write down the differential equation for the product formation:

\frac{dP}{dt} = \mu_{max}\frac{S}{K_S + S} \cdot X \cdot Y_{P/X}

Are you still reading? Yes? You must either be very interested and/or be a math geek like me… I would like to stop with the introduction here and discuss other things such as inhibition etc in a future post. I now would like to share some information how you could/can get the coefficients for the equations above from empirical data.

Coefficient determination from experimental data

All the data below is from a S. cerevisiae batch cultivation I cultivated during my undergraduate studies. I don’t want to get much into detail here but some information to understand the values you get afterwards. The batch cultivation was done in a 16 L reactor (4.2 gal) under sterile conditions and glucose as the only carbon source (substrate). All the values below therefore are for glucose only.

During the cultivation (8 h), every 30 min the optical density (OD) and glucose concentration was measured and every 60 min the dry mass was determined. The optical density is another measurement method to get an idea about the yeast concentration. The glucose was measured enzymatically and the dry mass was determined by filtration, drying of the filter paper and finally determining the mass of yeast on the filter paper.

µmax determination based on dry mass

As previously mentioned, the following equation can be used to get the µmax value by plotting the logarithmic ratio of the biomass against the time (t). This should give you a linear function with the slope µmax as shown in Fig 1:

ln(\frac{X_t}{X_{t0}}) = \mu_{max} \cdot t

TR1

Fig 1: Log dry mass ratio against time. µmax determined from slope of linear fit function

One can easily see that the amount of yeast grew steadily up to the time point of six hours where the yeast concentration stayed the same (Fig 1). After six-hour the whole glucose was already metabolized (not shown) and no further yeast growth could be observed (Fig 1). The linear fit function therefore only makes sense between time point zero and six hours. The slope of the linear fit function was 0.43 h-1. Please remember, this µmax value is for the dry mass and is close to known values [2].

Lets quickly calculate the doubling time for this µmax. This give you a doubling time of roughly 97 min. Not that far away from the 90 min stated in source [1].

µmax determination based on optical density (OD)

The same can be done for the OD (Fig 2).

OD

Fig 2: Log OD ratio against time. µmax determined from slope of linear fit function

Once again after five to six hours, the yeast growth came to a stop (Fig 2). This time the slope of the linear fit function was 0.53 h-1. A nice example that not every µmax is the same. One has to be very careful how the specific µmax was determined. Either based on the optical density, dry mass weight or even the cell count.

Biomass on substrate yield coefficient (YX/S)

To determine the yield coefficient, one can plot the measured yeast dry mass or OD against the measured glucose values and use the linear slope to determine the yield factors (Fig 3).

TR

Fig 3: Determine the biomass to glucose yield factor

The yield factor based on the dry mass was -0.5 g g-1, and -0.1 g g-1 for the OD. Known yield factors for yeast based on glucose and dry mass are between -0.3 and – 0.5 g g-1 [3].

Building growth models

Now its time to put all the equations and values into a model. The only coefficient not known so far is KS. This value is hard to determine and the easiest way to get this value is by iterative approaches. You simply use the model to get KS. I use Berkley Madonna for this purpose. What you have to do is input all the different differential equations, the measured values and run an iterative algorithm to let the model function approximate the measured values. If you do this the right way you might get graphs like below (Fig 4).

YeastKineticsBasic

Fig 4: Yeast kinetic model 1, explanation in text below

In this case the substrate concentration (S) and the yeast concentration (X) are plotted against time. In addition, the black dots correspond to the measured glucose concentrations. I included the values I used for the different coefficients in the graph as well. Unfortunately, one cannot fit the measured glucose concentration curve with the numerical values of the determined coefficients. I therefore had to use slightly different values for the yield coefficient (in this case 0.3 g g-1) and 0.51 h-1 for µmax. The differences between the numerical values of the parameters might be due to measuring inaccuracies for the glucose concentration and/or yeast concentration. In the end, one can determine KS to be around 0.031 g L-1.

You now can use the model to investigate how the different conditions affect the growth of the yeast. For instance different substrate conditions or inoculation rates. All this can be useful to understand the behaviour of yeast growth under different conditions. However, one has to keep in mind that all this is based on a simplified model and it does not have to represent reality. Model building is sometimes hard work because iteration processes might get stuck and lead to wrong results (such as negative substrate concentrations).

Summary

Growth kinetics models can be used to describe the growth of microorganisms. Because biological systems can hardly be approximated by simple fit functions, more sophisticated methods need to be applied. Such as the models described in this post.

Outlook

This was just a basic introduction about growth kinetics and models. Future posts will go into more details covering additions to the basic Monod model. The next post concerning growth kinetics will be about Brettanomyces growth and is a nice organism to introduce inhibition effects.

I would like to do some small-scale experiments with yeast propagation and determine the individual model-parameters in the future. The resulting models therefore might be useful to approximate yeast starters under different conditions. Just be patient, I am currently really busy with my real scientific work. Thanks for reading and comment if you like. Cheers!

Bibliography

[1] : http://dbb.urmc.rochester.edu/labs/sherman_f/yeast/4.html, “An Introduction to the Genetics and Molecular Biology of the Yeast Saccharomyces cerevisiae” (2012)
[2] : http://www.atcc.org (2012)
[3] : B. Sonnleitner, Lecture slides Bioprozesstechnik 1, ZHAW Wädenswil, 2010